

Geospatial applications operate at massive scales, requiring efficient ways to analyze relationships across millions of data points.
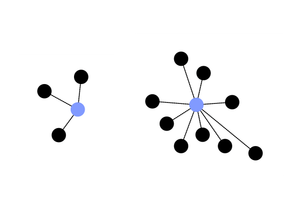
Finding the nearest point using a naive approach—calculating distances against every point in a dataset—becomes exponentially slow as data grows. Ideally, we want to isolate candidate subgroups before running distance calculations.
In market analysis use cases, raw data is rarely uniform. Working with sparse or biased datasets requires standardizing locations so trends can be generalized reliably.
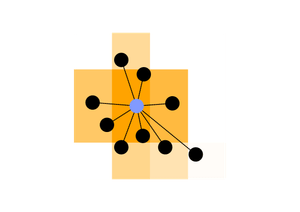
A spatial index solves this by grouping continuous coordinates into distinct spatial ‘folders’ (grid tiles or cells). Instead of querying millions of individual coordinates, search algorithms query specific indexed regions, transforming continuous geospatial data into structured, efficient, and scalable units.
Google’s S2 Index: The Grid-Based Solution
The most intuitive way to divide the Earth is a grid system aligned with latitude and longitude.
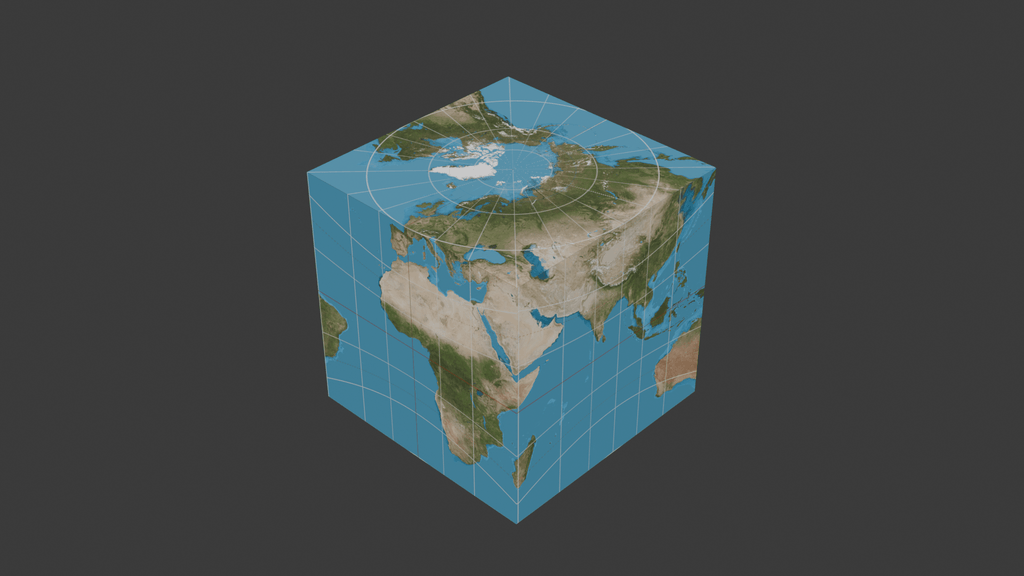
This is the design behind Google’s S2 index, which projects the Earth’s sphere onto a cube and subdivides it into square tiles. The S2 framework is hierarchical: each square recursively divides into four smaller sub-squares down to a resolution of ~1 cm².
While S2 served as an industry standard in the mid-2010s, especially after Google open-sourced it in 2017, it carries inherent structural drawbacks. Notice below the distortion in the latitude lines as they conform to S2’s divisions. This distortion means that even though the area of divisions stay equal, their shapes are not uniform.
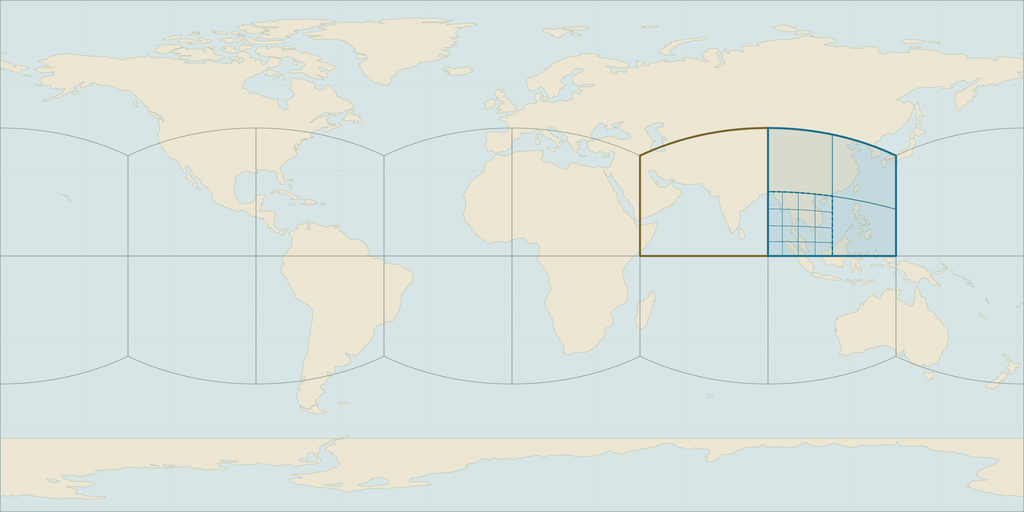
Key Characteristics of S2
- Grid Topology: S2 indexes the map using a grid of squares.
- Spherical Distortion: Projecting a sphere to a cube alters shape uniformity across geographic regions.
- Exact Containment: Prioritizes strict parent-child cell boundaries over geometric uniformity.
Uber’s H3 Index: A Hexagonal Refinement
To solve the geometric limitations of square grids, Uber introduced the H3 index in 2018. H3 replaces S2’s grid system with a hexagonal lattice projected onto an icosahedron (a 20-sided polyhedron).
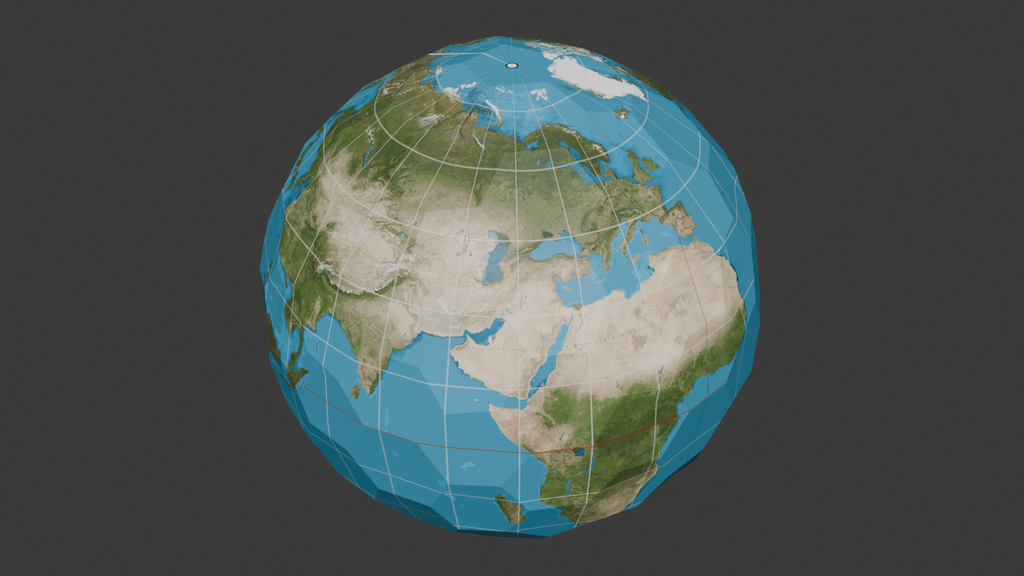
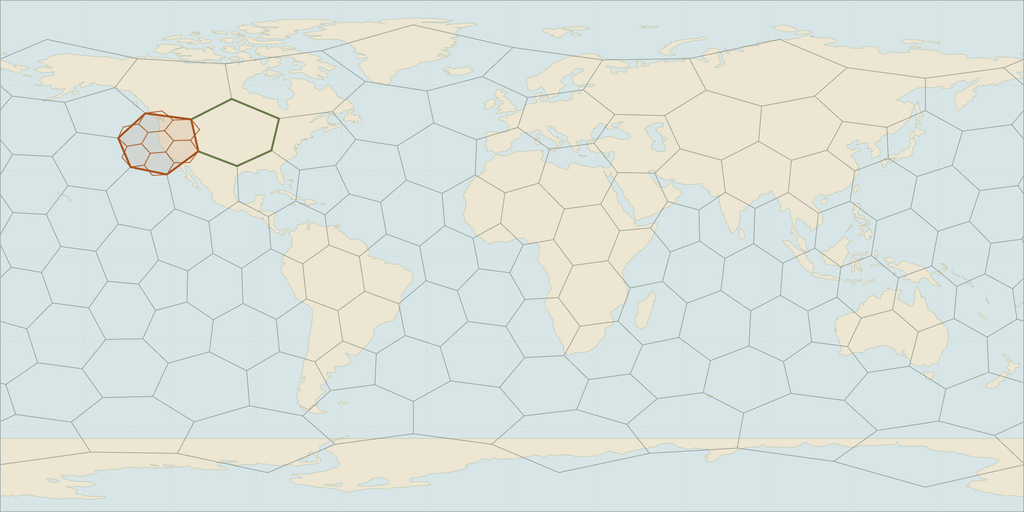
Being a better approximation of the Earth’s geometry, H3 experiences significantly less area and shape distortion. H3 retains the hierarchical design of S2 as each hexagon is subdivided into seven equivalent hexagons.
You may notice the topology is imperfect—subregions clip across parent tile boundaries, making H3 less ideal for strict containment constraints. Additionally, tiling a sphere requires 12 supplementary pentagons alongside hexagons to complete the icosahedron geometry. Strategically placed over oceans (such as off the Horn of Africa), these pentagons minimize real-world impact.
💡 Fun Fact: Locations of pentagonal tiles were inherited from the Dymaxion projection’s joining vertices to ensure none lay over land.
Moreover, hexagonal grids provide a major mathematical advantage: equidistant neighbor traversal. Every hexagonal cell shares an equal-length edge with all 6 surrounding neighbors. Square grids (like S2) have 8 neighbors divided into two classes: edge neighbors and diagonal/vertex neighbors, complicating distance and smoothing algorithms.
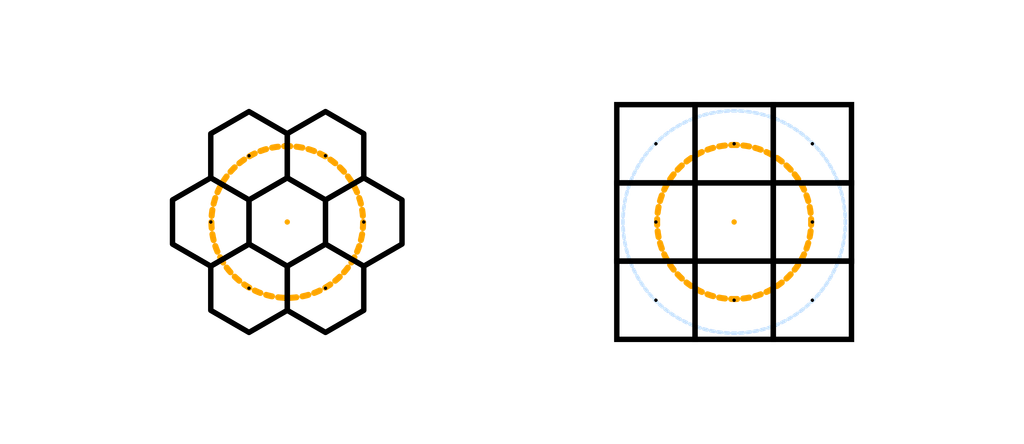
Key Characteristics of H3
- Hexagonal Lattice: H3 indexes the map using hexagonal tiles.
- Geometric Uniformity: Minimizes distortion, allowing for faster distance calculations and more accurate comparison between tiles.
- Approximate Hierarchy: Aperture-7 child hexagons clip parent borders, requiring careful handling during strict bounding queries.
S2 vs. H3 Index Comparison
| S2 Index | H3 Index | |
|---|---|---|
| Developer | Uber | |
| High-Level Geometry | Cube | Icosahedron |
| Tile Shape | Square tiles | Hexagonal tiles with a limited few Pentagonal tiles |
| Subdivision | 4 Squares | 7 Hexagons |
| Smallest Tile | ~0.7 cm2 | ~0.9 m2 |
| Tile Neighbors | 8 – Edge neighbors and vertex neighbors | 6 – Only edge neighbors |
| Best Use Case | Containment, geometry indexing, and strict bounding box queries | Spatial analytics, data smoothing, mobility modeling, region-to-region comparison and gradient representation |
Real-World Application: How We Apply H3 Index in Enterprise Analytics
Spatial indices are fundamental to platform engineering, particularly in tools like MasterScape designed to transform continuous geographic datasets into actionable location intelligence.
By utilizing the H3 spatial index within MasterScape, we address core spatial data challenges through several key optimizations:
- Fair Geographic Comparisons: Unlike arbitrary postal codes or distorted S2 grid cells, H3’s geometric uniformity ensures every region is directly comparable.
- Hyper-Local Granularity: MasterScape leverages H3 resolutions down to 24 m² (roughly the size of a single-car garage), unlocking precise local data modeling.
- Accurate Trend Gradients: Because all neighboring H3 tiles are equidistant, trend models smoothly reflect spatial shifts without the vertex-stretching distortions common to square grids.
- Site Selection & Opportunity Scoring: MasterScape calculates site suitability—factoring in foot traffic, brand footprint, and competitor density—into a unified Opportunity Score.
- Multi-Scale Spatial Analysis: High-resolution hexagonal tiling allows developers and analysts to evaluate localized candidate plots (e.g., specific tiles between Wan Chai and Causeway Bay) while preserving macro-level district trends (e.g., broad demand across Tsim Sha Tsui).
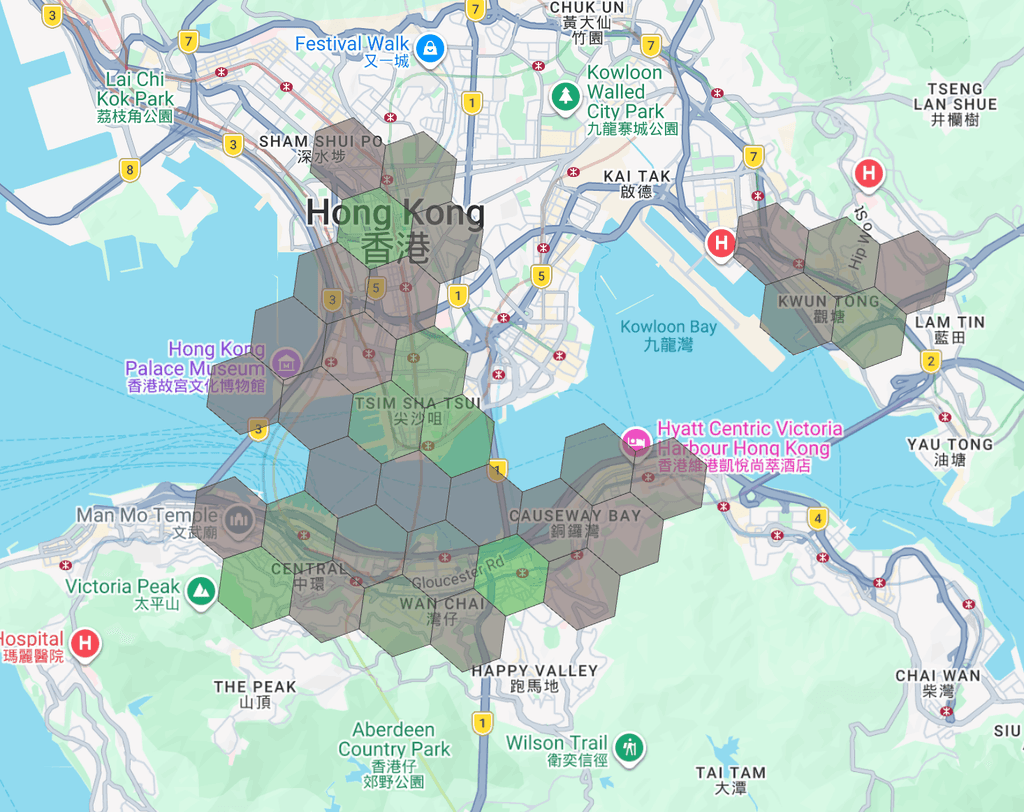
Data is only as useful as your representation allows it to be. With H3, we are able to return intuitive, legible, and accurate representations of MasterScape’s analyses.
Frequently Asked Questions (FAQ)
What is a spatial index?
A spatial index is a data structure optimized for geospatial data points, often utilizing location data to group together points to increase access and search efficiency.
What is the S2 spatial index?
The S2 index is a grid-based spatial index that projects the Earth onto a cube, creating a hierarchical system of squares which group together data points according to location within these nested tiles.
What is the H3 spatial index?
The H3 index projects the Earth onto an icosahedron and uses nested hexagonal lattices to store data points dependent on which tiles they are located inside.
What advantages does H3 have over S2?
H3’s tiles are significantly more uniform in shape which allows for more acute comparisons between tiles. Additionally, all neighboring tiles will be the same distance away from the central tile allowing for faster distance-based calculations.
When is S2 used over H3?
S2’s rigid boundaries ensure that a data point’s parent tile will be consistent between all resolution levels making S2 an ideal choice for boundary-sensitive applications.
How is a spatial index used in market analysis?
MasterScape relies on spatial indexing to discretize areas represented by data, revealing trends that can be easily visualized and used to create actionable insights.



![[Free Webinar] Road to COP17: Unifying Enterprise Data with Planetary-Scale Geospatial AI](https://masterconcept.ai/wp-content/uploads/2026/09/Webinar-261007-Unifying-Enterprise-Data-with-Planetary-Scale-Geospatial-AI-_1280x720px-scaled.png)